A quick word from me
This issue isn't sponsored - I write these deep dives in my free time and keep them free for everyone. If your company sells AI tools, dev tools, courses, or services that .NET developers would actually use, sponsoring an issue is the most direct way to reach them.
Want to reach thousands of .NET developers? Sponsor TheCodeMan →This issue is self-sponsored. By supporting my work and purchasing my products, you directly help me keep this newsletter free and continue creating high-quality, practical .NET content for the community.
Thank you for the support 🙌
P.S. I’m currently building a new course, Pragmatic .NET Code Rules, focused on creating a predictable, consistent, and self-maintaining .NET codebase using .editorconfig, analyzers, Visual Studio code cleanup, and CI enforcement.
The course is available for pre-sale until the official release, with early-bird pricing for early adopters. You can find all the details here.
Why .NET Monitoring Is Not Optional in Production
A .NET app rarely “dies” in production. More often:
- the API is running but can’t reach the database
- requests start timing out because connection pool is exhausted
- background jobs silently stop, but the process remains alive
- latency increases after a deployment, and you notice it hours later
That’s why production monitoring needs two layers:
- Health checks
- “Is the service alive? Is it ready?
- Metrics
- “How is it behaving over time?” This guide builds a complete .NET monitoring setup with:
- Health checks
- ASP.NET Core health checks (liveness + readiness)
- PostgreSQL dependency health
- Prometheus /metrics endpoint
- Grafana dashboards
- Docker Compose to run the entire stack locally like production
- custom metrics you can extend later
What Problem Health Checks and Metrics Actually Solve
Before writing code, let’s be clear about why this setup exists. In production, you need answers to questions like:
- Is the service running or just stuck?
- Is it ready to receive traffic?
- Are dependencies healthy?
- Are background jobs actually executing?
- Is performance degrading over time?
Health checks and metrics solve different problems:
Health checks answer binary questions
- Is the service alive?
- Is it ready to serve requests? Metrics answer behavioral questions
- How many requests per second?
- How long do requests take?
- How many jobs were processed?
- How often do failures happen? You need both.
What Prometheus Is?
Prometheus is a time-series metrics system. It does three key things:
- scrapes metrics from apps (pull model)
- stores them over time
lets you query them using PromQL Important detail for juniors:
- ✅ Your app exposes
/metrics - ✅ Prometheus periodically calls
/metrics - ✅ Prometheus stores the numeric values
- ❌ Prometheus is not a dashboard
What Grafana Is?
Grafana is a visualization layer. It:
- connects to Prometheus as a data source (in our case)
- turns metrics into dashboards
- can trigger alerts Prometheus stores data. Grafana makes it visible.
Understanding Liveness and Readiness Health Checks in .NET
One of the most common production mistakes is exposing a single health endpoint.
That leads to broken deployments and unnecessary restarts.
Liveness checks
Liveness answers one question:
Is the process running?
It must not check databases, HTTP calls, or external dependencies.
If this fails, the service is considered dead.
Readiness checks
Readiness answers a different question:
Is the service ready to handle traffic?
This must check:
- databases
- external APIs
- message brokers
If readiness fails, traffic should be stopped, but the service should not be killed.
We will expose two endpoints:
/health/live/health/ready
The Demo System We’ll Build (Two .NET Services + PostgreSQL)
We’ll build a small but realistic system consisting of:
- Orders API
- ASP.NET Core Web API
- Exposes health checks
- Exposes /metrics for Prometheus
- Billing Worker
- Background service
- Periodically processes jobs
- Exposes health checks
- Includes custom metric:
billing_jobs_processed_total
- PostgreSQL database
- Used as a readiness dependency
- Prometheus
- Scrapes metrics from both services
- Grafana
- Visualizes metrics via dashboards All services will run locally using Docker Compose, exactly like a real environment.
Orders API: Implementing Health Checks and Metrics
Add required NuGet packages:
dotnet add OrderManagement.Api package AspNetCore.HealthChecks.NpgSqldotnet add OrderManagement.Api package prometheus-net.AspNetCore
Explanation
AspNetCore.HealthChecks.NpgSqlgives us a ready-made PostgreSQL health probe.prometheus-net.AspNetCoreexposes/metricsand HTTP request metrics. Health check configuration (Program.cs): ```csharp var postgres = builder.Configuration.GetConnectionString("Postgres") ?? "Host=localhost;Port=5432;Database=orders;Username=postgres;Password=postgres";
// Health checks builder.Services.AddHealthChecks()
// Liveness: “process is alive”.AddCheck("self", () => HealthCheckResult.Healthy(), tags: new[] { "live" })// Readiness: “dependencies are reachable”.AddNpgSql(postgres, name: "postgres", tags: new[] { "ready" });
- self is the liveness probe- PostgreSQL is checked only for readiness Health endpoints:
csharp var app = builder.Build();
app.UseHttpMetrics(); app.MapMetrics("/metrics");
app.MapHealthChecks("/health/live", new HealthCheckOptions {
Predicate = r => r.Tags.Contains("live")
});
app.MapHealthChecks("/health/ready", new HealthCheckOptions {
Predicate = r => r.Tags.Contains("ready")
});
app.MapGet("/api/ping", () => Results.Ok (new { ok = true, at = DateTimeOffset.UtcNow }));
Explanation- `/health/live` checks only the app itself.- `/health/ready` checks PostgreSQL connectivity.- `/metrics` exposes Prometheus-format metrics.- `UseHttpMetrics()` auto-collects request metrics. ## Billing Worker: Add an HTTP host + Health + Custom Metrics You need the same packages as for the Order API.A worker template doesn’t expose HTTP endpoints by default. But we want:- `/health/*`- `/metrics` So we host a minimal web server **inside the worker**. Billing.Worker/Program.cs
csharp using Microsoft.AspNetCore.Builder; using Microsoft.AspNetCore.Diagnostics.HealthChecks; using Microsoft.Extensions.Diagnostics.HealthChecks; using Prometheus;
namespace OrderManagement.Billing.Worker;
public partial class Program {
private static void Main(string[] args){ var builder = WebApplication.CreateBuilder(args); var postgres = builder.Configuration.GetConnectionString("Postgres") ?? "Host=localhost;Port=5432;Database=appdb;Username=app;Password=app"; // Health checks builder.Services.AddHealthChecks() .AddCheck("self", () => HealthCheckResult.Healthy(), tags: new[] { "live" }) .AddNpgSql(postgres, name: "postgres", tags: ["ready"]); // Background job runner builder.Services.AddHostedService<BillingJobRunner>(); var app = builder.Build(); // Metrics app.UseHttpMetrics(); app.MapMetrics("/metrics"); // Health endpoints app.MapHealthChecks("/health/live", new HealthCheckOptions { Predicate = r => r.Tags.Contains("live") }); app.MapHealthChecks("/health/ready", new HealthCheckOptions { Predicate = r => r.Tags.Contains("ready") }); app.Run();} // Custom business metric: how many jobs were processedpublic static readonly Counter JobsProcessed = Metrics.CreateCounter( "billing_jobs_processed_total", "Total number of billing jobs processed."); internal sealed class BillingJobRunner : BackgroundService{ protected override async Task ExecuteAsync(CancellationToken stoppingToken) { while (!stoppingToken.IsCancellationRequested) { // Simulate “job processed” JobsProcessed.Inc(); await Task.Delay(TimeSpan.FromSeconds(2), stoppingToken); } }}
}
Explanation- This worker now exposes `/metrics` and health endpoints.- `billing_jobs_processed_total` is a **custom metric** you’ll graph in Grafana.- This is how you monitor background processing in real systems.. ## Docker: Containerize both .NET services correctly This is where my previous version was too hand-wavy. Here’s the correct, production-style approach: **multi-stage Dockerfiles**. OrderManagement.Api/Dockerfile:
csharp FROM mcr.microsoft.com/dotnet/aspnet:10.0 AS base WORKDIR /app EXPOSE 8080 EXPOSE 8081
FROM mcr.microsoft.com/dotnet/sdk:10.0 AS build ARG BUILDCONFIGURATION=Release WORKDIR /src COPY ["OrderManagement.Api/OrderManagement.Api.csproj", "OrderManagement.Api/"] RUN dotnet restore "./OrderManagement.Api/OrderManagement.Api.csproj" COPY . . WORKDIR "/src/OrderManagement.Api" RUN dotnet build "./OrderManagement.Api.csproj" -c $BUILDCONFIGURATION -o /app/build
FROM build AS publish ARG BUILDCONFIGURATION=Release RUN dotnet publish "./OrderManagement.Api.csproj" -c $BUILDCONFIGURATION -o /app/publish /p:UseAppHost=false
FROM base AS final WORKDIR /app COPY --from=publish /app/publish . ENTRYPOINT ["dotnet", "OrderManagement.Api.dll"]
Billing.Worker/Dockerfile:
csharp FROM mcr.microsoft.com/dotnet/aspnet:10.0 AS base WORKDIR /app
FROM mcr.microsoft.com/dotnet/sdk:10.0 AS build ARG BUILDCONFIGURATION=Release WORKDIR /src COPY ["OrderManagement.Billing.Worker/OrderManagement.Billing.Worker.csproj", "OrderManagement.Billing.Worker/"] RUN dotnet restore "./OrderManagement.Billing.Worker/OrderManagement.Billing.Worker.csproj" COPY . . WORKDIR "/src/OrderManagement.Billing.Worker" RUN dotnet build "./OrderManagement.Billing.Worker.csproj" -c $BUILDCONFIGURATION -o /app/build
FROM build AS publish ARG BUILDCONFIGURATION=Release RUN dotnet publish "./OrderManagement.Billing.Worker.csproj" -c $BUILDCONFIGURATION -o /app/publish /p:UseAppHost=false
FROM base AS final WORKDIR /app COPY --from=publish /app/publish . ENTRYPOINT ["dotnet", "OrderManagement.Billing.Worker.dll"]
Explanation- The SDK image builds the app.- The runtime image runs the published output.- Both listen on port 8080 inside their containers. ## Docker Compose: Start in the correct order (DB → apps → Prometheus → Grafana) Create `docker-compose.yml` in the solution root:
csharp services: postgres:
image: postgres:16environment: POSTGRES_DB: orders POSTGRES_USER: postgres POSTGRES_PASSWORD: postgresports: - "5433:5433"
orders-api:
build: context: . dockerfile: OrderManagement.Api/Dockerfileenvironment: ConnectionStrings__Postgres: Host=postgres;Port=5433;Database=orders;Username=postgres;Password=postgresports: - "8082:8080"depends_on: - postgres
billing-worker:
build: context: . dockerfile: OrderManagement.Billing.Worker/Dockerfileenvironment: ConnectionStrings__Postgres: Host=postgres;Port=5433;Database=orders;Username=postgres;Password=postgresports: - "8081:8080"depends_on: - postgres
prometheus:
image: prom/prometheus:latestvolumes: - ./prometheus.yml:/etc/prometheus/prometheus.yml:roports: - "9090:9090"depends_on: - orders-api - billing-worker
grafana:
image: grafana/grafana:latestvolumes: - ./ops/grafana/provisioning:/etc/grafana/provisioning:ro - ./ops/grafana/dashboards:/var/lib/grafana/dashboards:roports: - "3003:3000"depends_on: - prometheus
Explanation- Postgres must exist before readiness checks can pass.- Both .NET apps start after Postgres.- Prometheus starts after apps because it needs targets to scrape.- Grafana starts after Prometheus because it needs a data source. 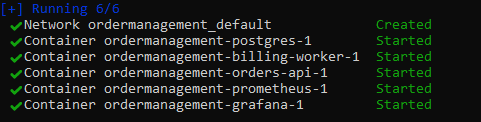 ## How to Add Scraping Configuration with Prometheus - /metrics Create `ops/prometheus/prometheus.yml` in your root folder of the solution:
csharp global: scrape_interval: 5s
scrape_configs:
jobname: "orders-api" metricspath: /metrics static_configs:
- targets:
- "orders-api:8080"
- targets:
jobname: "billing-worker" metricspath: /metrics static_configs:
- targets:
- "billing-worker:8080" ```
- targets:
Explanation
- Prometheus scrapes every 5 seconds.
- Each .NET service becomes its own job.
- targets are Docker service names - Docker Compose provides DNS for them.
How to Add a Grafana Container: Provision the Prometheus datasource automatically
ops/grafana/provisioning/datasources/datasource.yml
apiVersion: 1 datasources: - name: Prometheus type: prometheus access: proxy url: http://prometheus:9090 isDefault: true
Explanation
- Grafana will start with Prometheus already connected.
- This is how teams avoid the “works on my machine” dashboard setup.
Run everything and verify each layer
Start the stack:
docker compose up --build
Now verify in this order:
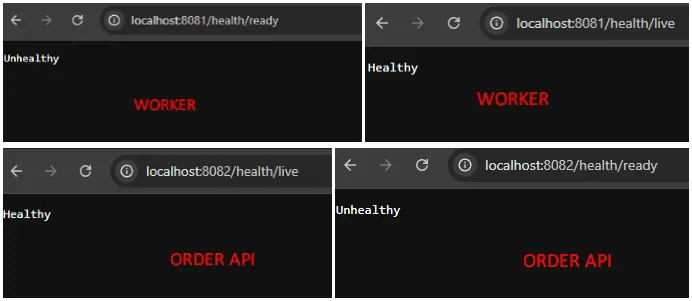
1) Check health endpoints
- Orders API liveness:
http://localhost:8082/health/live - Orders API readiness:
http://localhost:8082/health/ready - Worker readiness:
http://localhost:8081/health/ready
2) Check /metrics
- Orders API metrics:
http://localhost:8082/metrics - Worker metrics:
http://localhost:8081/metrics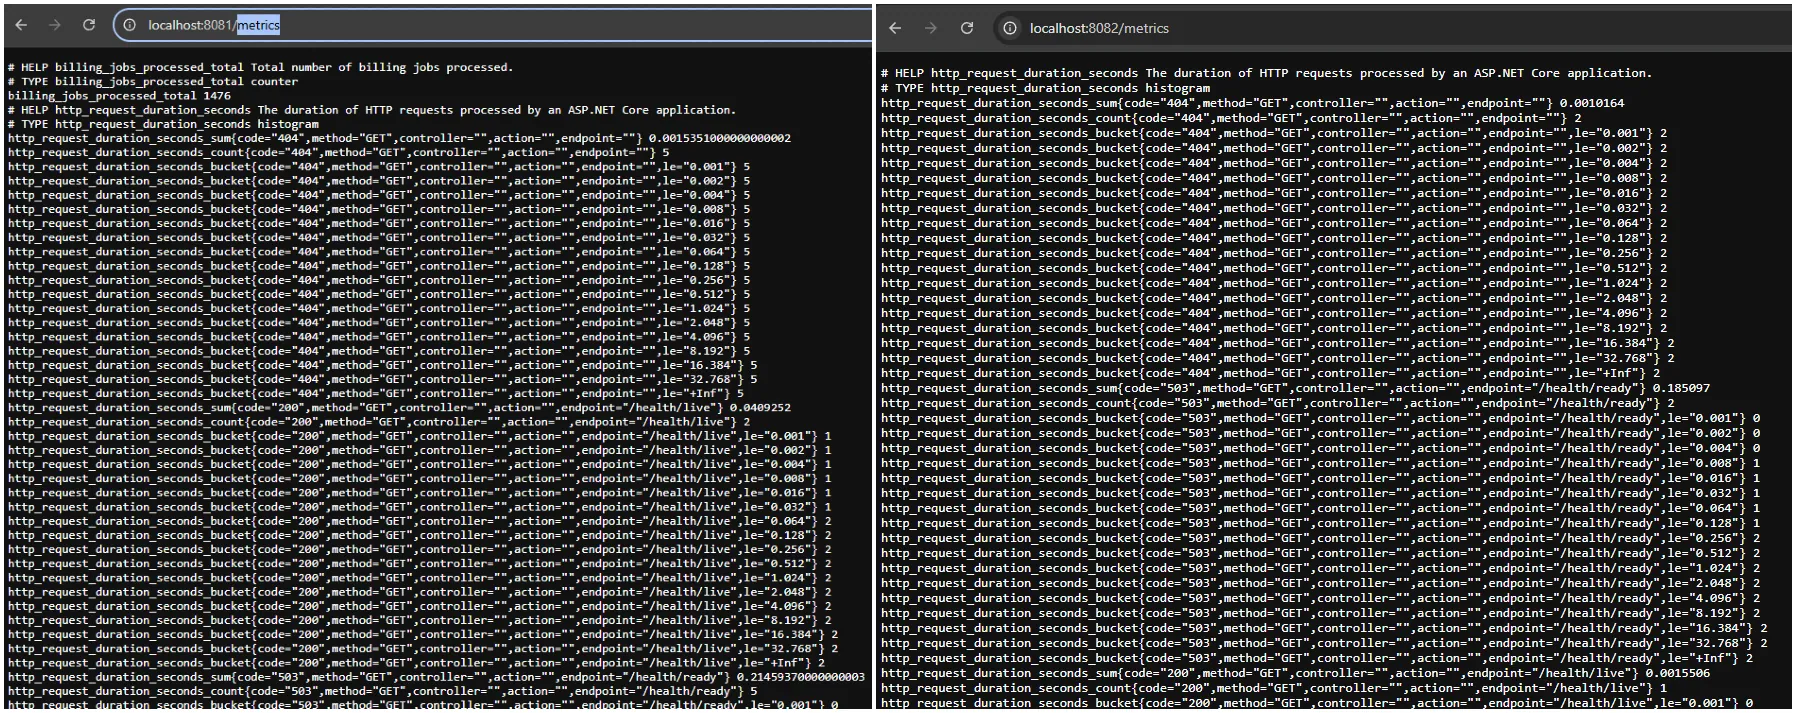
Look for:
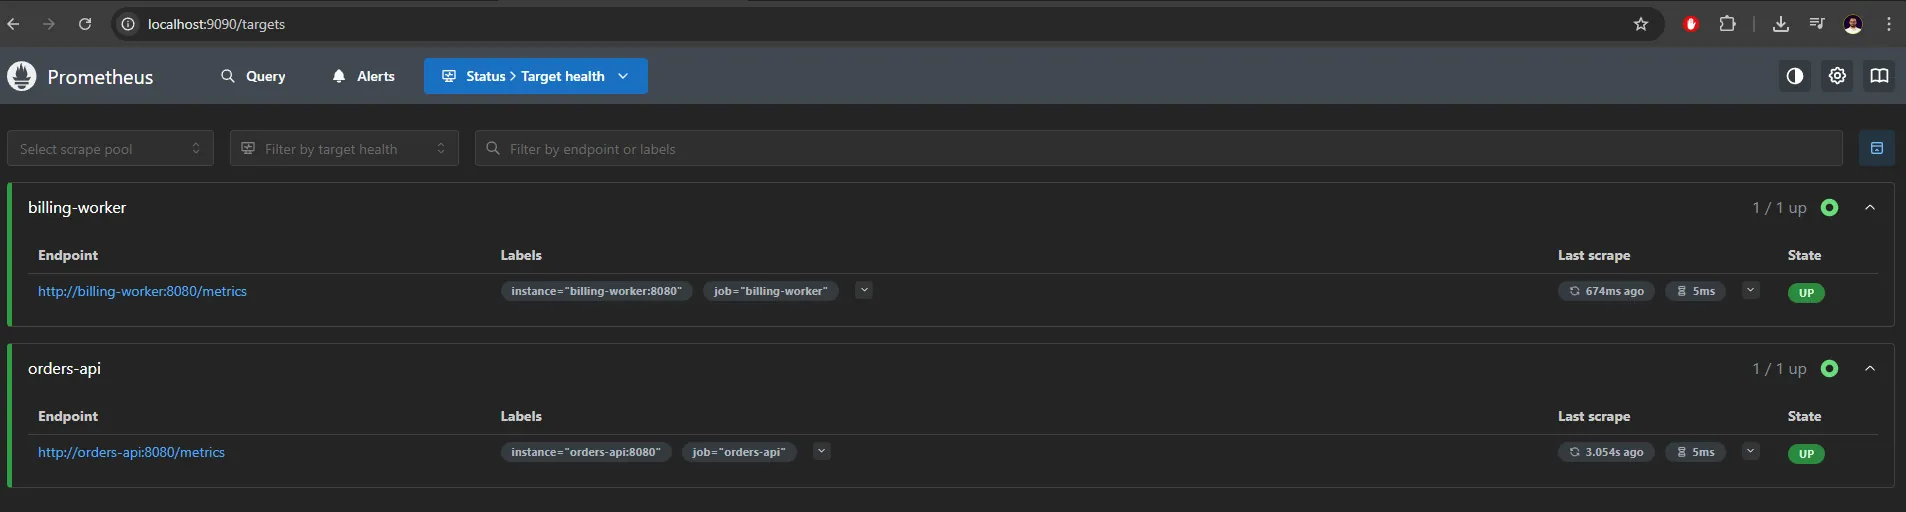
http_requests_received_totalbilling_jobs_processed_total3) Check Prometheus targets
- Prometheus UI:
http://localhost:9090 - Go to Status → Targets
- Both targets should be UP
4) Check the Grafana dashboard
- Grafana:
http://localhost:3000(default loginadmin/admin)
At this point, Prometheus is already running and successfully scraping metrics from both .NET services.
Grafana is also running, but it doesn’t show anything yet, because dashboards do not exist by default.
So, let's create the first dashboard.
Before creating a dashboard, Grafana needs to know where the metrics are coming from.
- In the left-hand menu, click Connections → Data sources
- You should already see Prometheus in the list
- If you used provisioning, it will be there automatically
- Click on Prometheus
- Verify the URL:
http://prometheus:9090 - Click Save & Test
You should see a green confirmation message saying that the data source is working.
Now we can create a dashboard.
- In the left-hand menu, click Dashboards
- Click New
- Click New dashboard
- Click Add visualization
Grafana will now ask you to choose a data source.
- Select Prometheus
At this point, you are inside the panel editor.
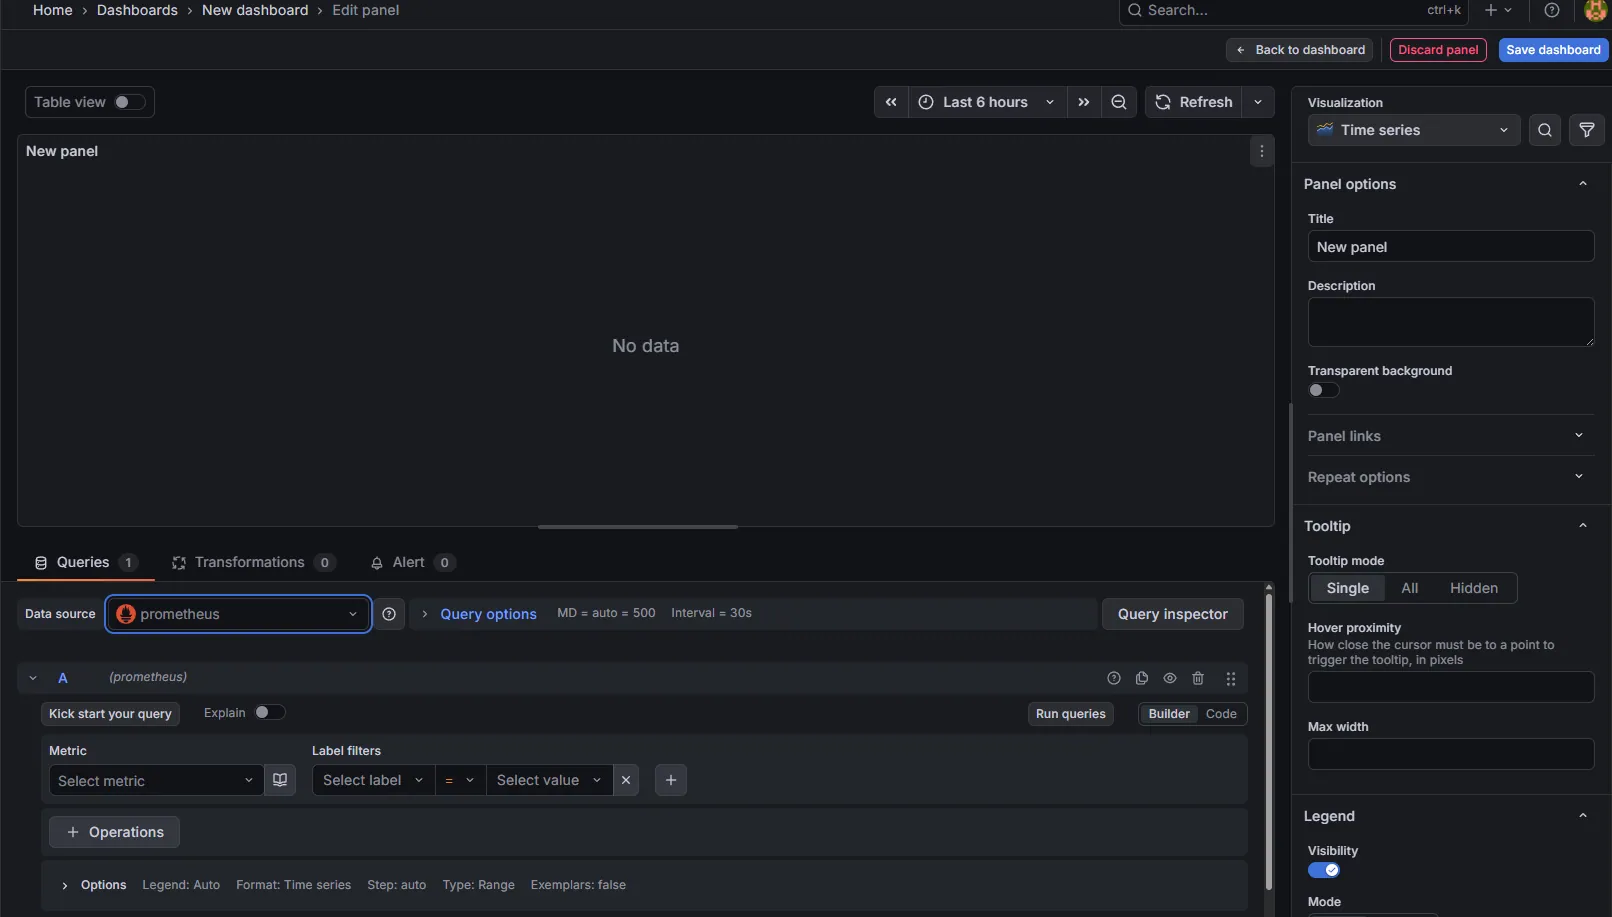
5) Create Your First Panel (HTTP Requests per Second)
Let’s start with a very common and useful metric: HTTP requests per second for the Orders API.
Write the PromQL query
In the Query section, enter:
rate(http_requests_received_total{job="orders-api"}[1m])
You should get something like this:
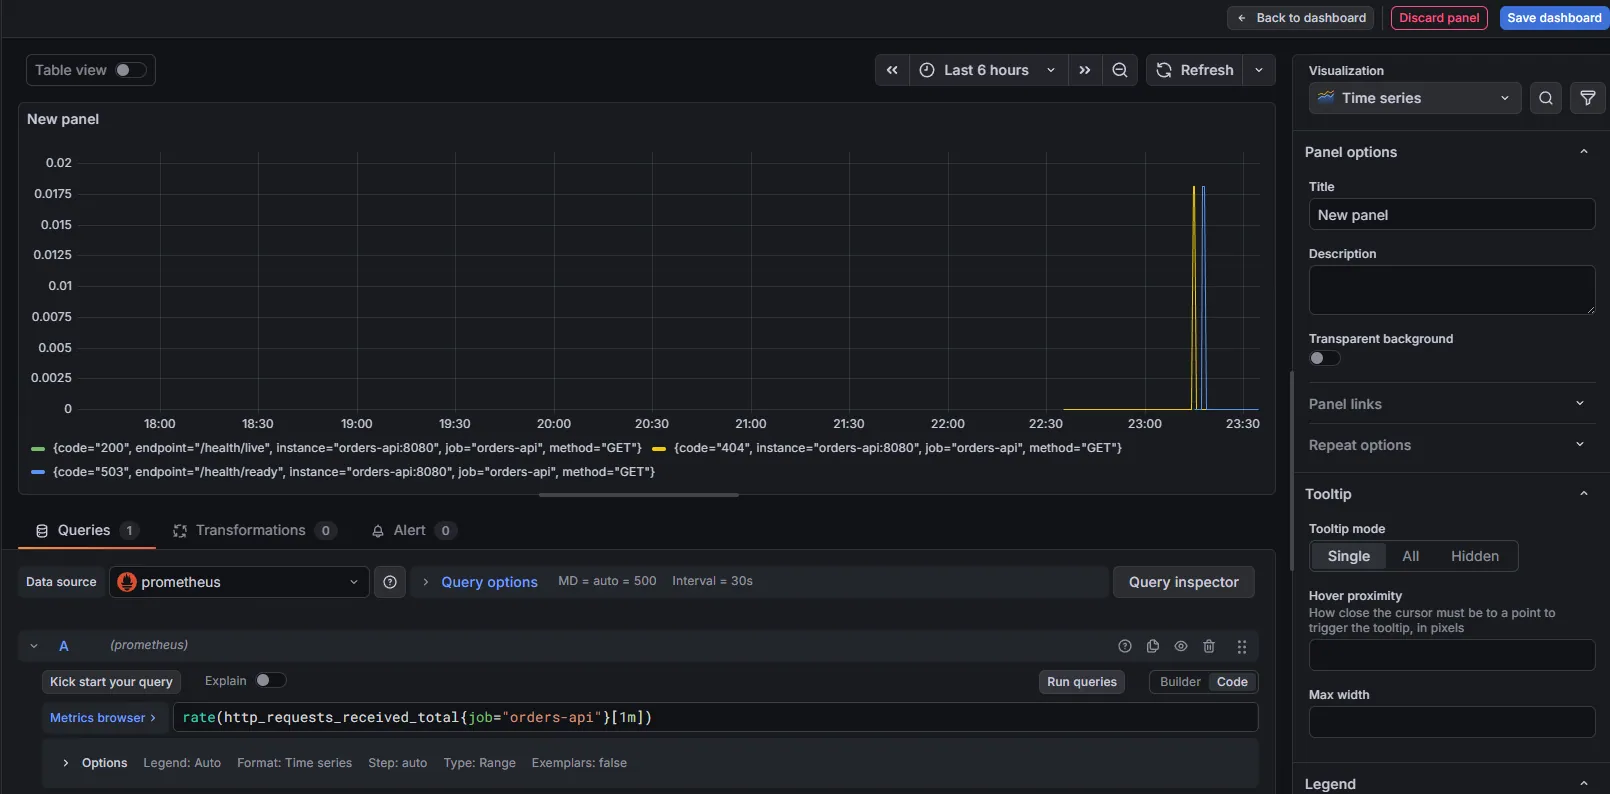
Give it a name and save Dashboard.
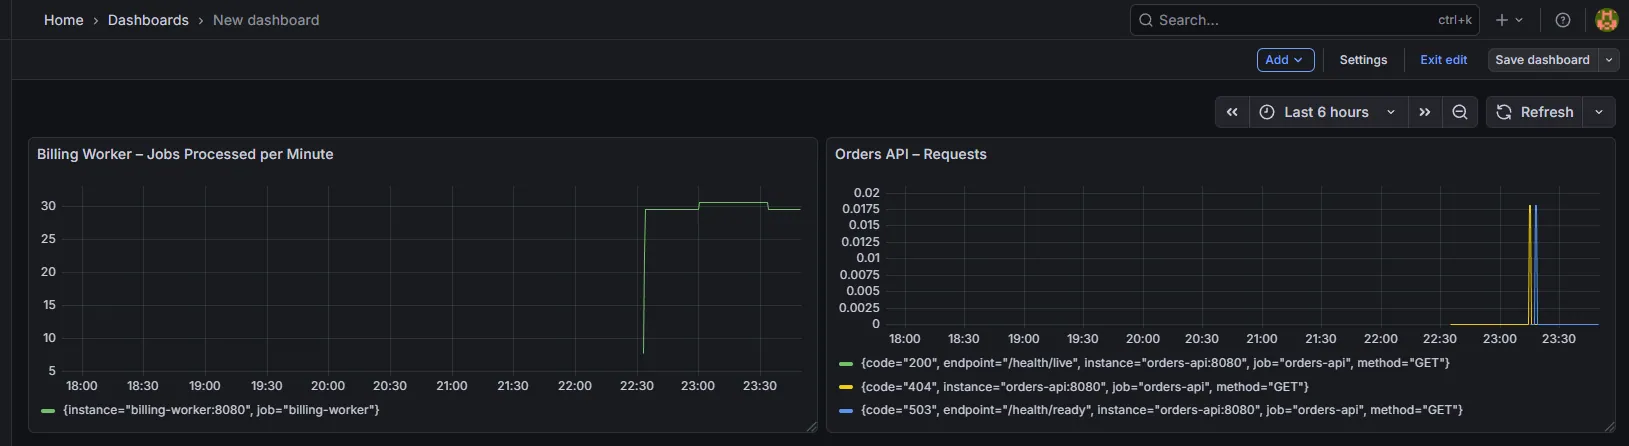
Okay, what about the custom metric we have added: billing_jobs_processed_total
Let's use the same approach and in the Query section write:
rate(billing_jobs_processed_total[1m]) * 60
What this shows
- approximate jobs per minute
- easier for non-technical stakeholders to understand
For more observability tools, check out OpenTelemetry in .NET, Structured Logging with Serilog, and Health Checks.
Wrapping Up: Monitoring Is a Skill, Not a Tool
Monitoring is not something you “add later”.
It’s a skill. And like every skill, it’s built through:
- understanding the concepts
- wiring the system end to end
- knowing what actually matters in production
In this article, you saw:
- How liveness and readiness health checks should really be used
- How to expose meaningful /metrics from .NET
- How Prometheus scrapes those metrics
- How Grafana turns them into answers
- How to monitor background work, not just HTTP requests
This is the baseline I expect in real .NET systems, not an advanced setup, not over-engineered, just correct.
📦 Want the Full Source Code?
All source code from this article (projects, Docker setup, Prometheus config, Grafana dashboards) is available for free inside my private .NET community.
🎓 This Topic Goes Even Deeper in My Upcoming Course
I’m currently building a course focused on production-grade .NET practices, not theory, not “hello world”.
Monitoring is a core chapter in that course.
We’ll go deeper into:
- alerting strategies (what should wake you up at night)
- PromQL basics for .NET developers
- choosing the right metrics (and avoiding metric noise)
- OpenTelemetry integration
- structuring monitoring across multiple services
- and common production mistakes teams repeat for years
The course is currently available for $59.89.
Here is the HINT:👇 Community members get an even bigger discount. (shhh, I didn't say that)
So if you’re thinking: “I want the source code anyway…”
Joining the group first is simply the smarter move.
P.S. Follow me on YouTube.